That Was Easy
As you know its the birthday of Dr. Seuss this Wednesday. It is during this time that our school participates in the Six Fag Reading Challenge. If the children read six hours, and record the time they read on a form they receive a free pass to the amusement park. Typically most of the students in my classroom do not participate. It's not because they are not reading. They are. Reasons vary between not wanting to bother filling out a sheet to a lack of interest in Six Flags. Personally, my heart sings to know that my students are reading for themselves. Not to prove it to me or because of some enticement from an outside source. They are reading for enjoyment. (Isn't that what we want them to do?)
Because we are nearing Read Across America it is expected that we keep track of the time spent reading. My students already stated their distaste in writing down the titles and time. I decided to combine a few things that I knew would most likely engage the children in the process. I know that my students enjoy using technology, and have grown affectionate towards the iPods. I also know that they have been debating whether or not e-readers improve reading and/or learning. So why not combine forces?
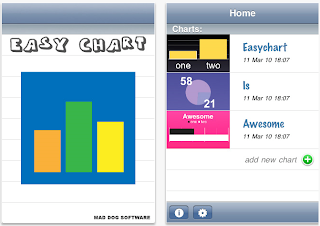
 iTunes has an app called Easy Chart. It certainly does live up to its name. All you have to do is give your graph a title, figure out the data you are collecting and voila, you are ready to track. With a bit of modeling, my students quickly set up their own charts. They decided to graph all time spent reading and time spent reading on an e-reader only. With a few clicks each day they are able to add time spent reading to their chart. They love it. Not only because of the tool they are using, iPod, but because Easy Chart provides choice for them. They can choose what type of graph to create ~ bar, circle, or line. They can also choose which color scheme to make their graph.
 One of the features that I love is that once done entering the information, the children can email, copy, capture, or post the graph. Because it is the free version they are unable to post it to twitter, but I'm okay with that (I think). They email the graph to me and I house it in our Picasa albums. But here's the thing, graphs are mathematical stories. And a series of graphs on the same topic is equivalent to a narrative nonfiction book. The children will be able to look at the various graphs of their reading and determine what story it tells of their reading life. They will also be able to make draw a more accurate conclusion of whethter or not Nooks made them a better reader and/or learner.
One thing that I realized is that having them email me their graphs creates a lot of unneccesary additional work for me. It would have been easier for them to email the graph to themselves. Plus it would have been less of a hassle for them to access the pictures in Picasa (we have trouble at times with the hardware). We will be using Connect - A - Sketch or another digital story tool to create a mathematical story of our reading lives. I will get back to you on how that goes!

Comments
Post a Comment